0%

科大讯飞|线下商店销量预测挑战赛top7方案

最近参加了科大讯飞的线下商店销量预测挑战赛,线上成绩0.66,最终排名第七,这里把自己的方案分享出来,欢迎大家交流讨论!代码和数据均已上传到GitHub:
https://github.com/Smallviller/KDXF_sales_forecast_competition

赛题说明

比赛传送门:https://challenge.xfyun.cn/topic/info?type=offline-store-sales-forecast

赛题任务

给定商店销量历史相关数据和时间等信息,预测商店对应商品的周销量。

数据说明

训练集:33周的历史销量数据
测试集:34周的销量
数据字段:字段shop_id(店铺id)、 item_id(商品id)、week(周标识)、item_price(商品价格)、item_category_id(商品品类id)、weekly_sales(周销量)组成。
image.png
可以发现这里的shop_id、item_id、week和item_category_id进行了脱敏处理,经过简单探索,发现:

  1. shop_id共有32个,item_id共有523个、item_category_id共有34个,shop和item是多对多的关系,通过shop*item可标识唯一商品。

  2. item_price存在大量空值,比率达73%

  3. weekly_sales大多偏低,集中在0和1,存在间歇性需求的问题

特征工程

一般销量预测,特征工程主要从这几个方面入手:时间相关特征、历史销量相关特征、价格相关特征...不过这里的时间特征被脱敏了,用不到,所以特征工程主要从销量和价格入手。

销量相关特征

  1. 滞后特征:滞后 1-14周的销量

  2. 滑动特征:滑动2-14周销量的min/max/median/mean/std

  3. 类别encoding特征:每个item、shop、item_category、shop*item_category、shop*item销量的mean和std

  4. 类别滞后特征:每个item、shop、item_category滞后1-14周的销量

价格相关特征

  1. 价格原始值:包含原始特征和填充特征,填充策略采用先向前填补再向后填补,最后没填补到的在用众数填补

  2. 类别encoding特征:每个item、shop、item_category、shop*item_category、shop*item价格的mean和std

  3. 价格差异特征:当前价格与shop、item、item_cat、shop_cat、shop_item的价格均值的差值

  4. 价格变动特征:当前价格与上周价格/上个月平均价格的差值

模型

模型

只使用了lightgbm

损失函数

训练的损失函数采用tweedie,由于存在间歇性需求的问题,很多商品的销量的销量为0,满足tweedie分布,因此采用tweedie作为损失函数效果要比mse要更好

交叉验证策略

由于时间序列的数据存在先后,只能用历史来预测未来,因此在交叉验证的时候就得格外小心,不能使用随机划分,因为这样会泄露未来的数据,但是时序也有自己的一套交叉验证方法,我这里使用了三折交叉。
使用三折交叉验证,建立三个lgb模型:

  1. 模型1:训练集使用1-30周数据,验证集使用31周数据,早停100轮
  2. 模型2:训练集使用1-31周数据,验证集使用32周数据,早停100轮
  3. 模型3:训练集使用1-32周数据,验证集使用33周数据,早停100轮

特征工程、模型的调参等都是基于这个交叉策略来做的,最后将这三个模型取简单平均。
为什么不用五折交叉?五折交叉融合的效果不太好,经试验3折融合的成绩是最好的

后处理

由于树模型无法捕捉到趋势,只能学习到历史的东西,不能外推,预测的时候就容易偏高或者偏低,所以提交的时候其实还试着给结果乘上了一个系数1.025,这也是kaggle上很多时序比赛用的一个trick,结果大概能提升0.005个点吧

一些本地有效果但线上不能提分的尝试

  1. 分shop、item、item_category建模,以及这几种方式得到结果的简单平均融合,按理来说在数据量足够的情况下,对每个类别分别建一个模型应该是比全部数据一起建模效果要好的,不过线上无提升

  2. 去掉部分重要度特征不高的特征后建模,用到的特征有159个之多,试着使用特征过滤的手段去掉部分无用特征,仍然是本地有提升,线上无提升

  3. 训练集删掉前15周的数据进行建模,由于构造了很多lag特征,导致了前15周一些特征都是空值的情况,试着把这部分数据删掉,并且越早的数据对于之后的预测越没用,所以按理删掉这些数据应该是能有所提升的,但是还是本地有提升,线上无提升

  4. ...

总结

第一次比较投入的去参加这种比赛,感觉还是蛮靠运气和一些trick的,最后怎么弄都上不了分,不知道瓶颈卡在哪了,或许对数据做更多的探索,以及换一些深度的模型能上分吧,再接再励!

代码

数据预处理

1
2
3
4
5
6
7
8
9
10
11
12
13
14
15
16
17
18
19
20
21
22
23
24
25
26
27
28
29
30
31
32
33
34
35
36
37
38
39
40
41
42
43
44
45
46
47
48
49
50
51
52
53
54
55
import pandas as pd

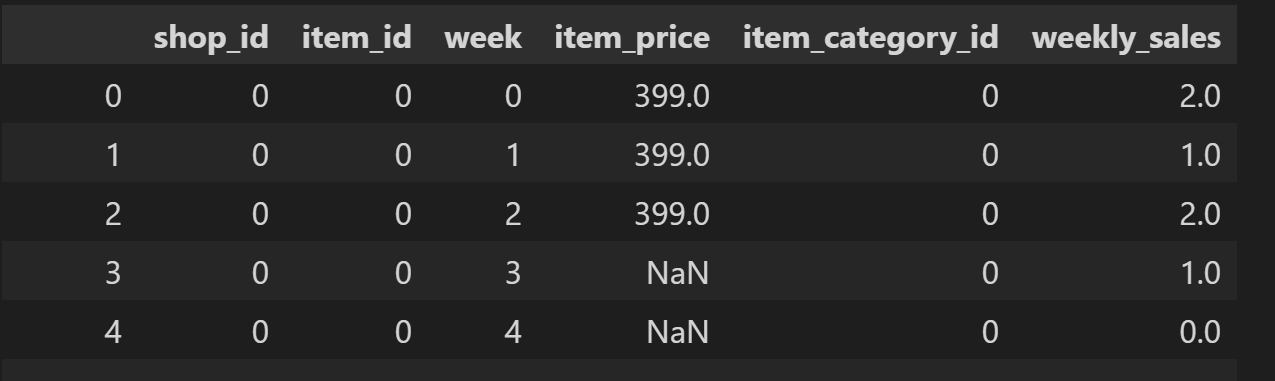
# 合并训练测试
train = pd.read_csv('./线下商店销量预测_数据集/train.csv')
test = pd.read_csv('./线下商店销量预测_数据集/test.csv')
df=pd.concat([train,test]).reset_index(drop=True)
df=df.sort_values(['shop_id','item_id','week'])

# 用来做滑动和滞后特征的函数
def makelag(data,values,shift):
lags=[i+shift for i in range(15)]
rollings=[i for i in range(2,15)]
for lag in lags:
data[f'lag_{lag}']=values.shift(lag)
for rolling in rollings:
data[f's_{shift}_roll_{rolling}_min']=values.shift(shift).rolling(window=rolling).min()
data[f's_{shift}_roll_{rolling}_max']=values.shift(shift).rolling(window=rolling).max()
data[f's_{shift}_roll_{rolling}_median']=values.shift(shift).rolling(window=rolling).median()
data[f's_{shift}_roll_{rolling}_std']=values.shift(shift).rolling(window=rolling).std()
data[f's_{shift}_roll_{rolling}_mean']=values.shift(shift).rolling(window=rolling).mean()
return data

# 对每个item都做滞后和滑动特征
df=df.groupby(['shop_id','item_id']).apply(lambda x:makelag(x,x['weekly_sales'],1))
# 价格填充特征,先用前一个值填补,再向后填补,最后没填补到的用那个item的价格众数填补
df['item_price_fill']=df.groupby(['shop_id','item_id'])['item_price'].apply(lambda x: x.ffill().bfill())
df['item_price_fill']=df.groupby(['item_id'])['item_price_fill'].apply(lambda x: x.fillna(x.mode()[0]))
# 对于每个shop,item,item_cat,shop*item_cat,shop*item分别做价格和销量的mean/std encoding,
for func in ['mean','std']:
df[f'shop_sale_{func}']=df.groupby(['shop_id'])['weekly_sales'].transform(func)
df[f'category_sale_{func}']=df.groupby(['item_category_id'])['weekly_sales'].transform(func)
df[f'item_sale_{func}']=df.groupby(['item_id'])['weekly_sales'].transform(func)
df[f'shop_cat_sale_{func}']=df.groupby(['shop_id','item_category_id'])['weekly_sales'].transform(func)
df[f'shop_item_sale_{func}']=df.groupby(['shop_id','item_id'])['weekly_sales'].transform(func)
df[f'shop_price_{func}']=df.groupby(['shop_id'])['item_price'].transform(func)
df[f'category_price_{func}']=df.groupby(['item_category_id'])['item_price'].transform(func)
df[f'shop_cat_price_{func}']=df.groupby(['shop_id','item_category_id'])['item_price_fill'].transform(func)
df[f'item_price_{func}']=df.groupby(['item_id'])['item_price'].transform(func)
df[f'shop_item_price_{func}']=df.groupby(['shop_id','item_id'])['item_price_fill'].transform(func)
# 价格差异特征,当前价格与shop、item、item_cat、shop_cat、shop_item的价格均值的差值
df['shop_price_diff']=df['shop_price_mean']-df['item_price_fill']
df['item_price_diff']=df['item_price_mean']-df['item_price_fill']
df['cat_price_diff']=df['category_price_mean']-df['item_price_fill']
df['shop_cat_price_diff']=df['shop_cat_price_mean']-df['item_price_fill']
df['shop_item_price_diff']=df['shop_item_price_mean']-df['item_price_fill']
# 当前价格与上周价格的差值,当前价格与上个月价格均值的差值
df['week_price_diff']=df.groupby(['shop_id','item_id'])['item_price_fill'].apply(lambda x: x-x.shift(1))
df['month_price_diff']=df.groupby(['shop_id','item_id'])['item_price_fill'].apply(lambda x: x-x.shift(1).rolling(4).mean())
# 销量的滞后特征,对于每个item、item_cat、shop的聚合平均值
for lag in [i for i in range(1,16)]:
df[f'item_lag_{lag}']=df.groupby(['item_id','week'])[f'lag_{lag}'].transform('mean')
df[f'cat_lag_{lag}']=df.groupby(['item_category_id','week'])[f'lag_{lag}'].transform('mean')
df[f'shop_lag_{lag}']=df.groupby(['shop_id','week'])[f'lag_{lag}'].transform('mean')

df.to_pickle('data.pkl')

模型

1
2
3
4
5
6
7
8
9
10
11
12
13
14
15
16
17
18
19
20
21
22
23
24
25
26
27
28
29
30
31
32
33
34
35
36
37
38
39
40
41
42
43
44
45
46
47
48
49
50
51
52
53
54
55
import pandas as pd
import numpy as np
from sklearn.metrics import mean_squared_error
import lightgbm as lgb

# 读取数据
df=pd.read_pickle('data.pkl')
# 三折交叉
cvs=[32,31,30]
params = {
'objective': 'tweedie',
'tweedie_variance_power':1.6,
'metric': 'mse',
'num_leaves': 2**7-1,
'reg_lambda': 50,
'colsample_bytree': 0.6,
'subsample': 0.6,
'subsample_freq': 4,
'learning_rate': 0.015,
'n_estimators':2000,
'seed': 1024,
'n_jobs':-1,
'silent': True,
'verbose': -1,
}
y_preds=[]
scores=[]
for cv in cvs:
print('='*10+str(cv)+'='*10)
train=df[df['week']<cv]
val=df[df['week']==cv]
test=df[df['week']==33]
X_train=train.drop(columns=['weekly_sales'])
y_train=train['weekly_sales']
X_test=test.drop(columns=['weekly_sales']
y_test=test['weekly_sales']
X_val=val.drop(columns=['weekly_sales'])
y_val=val['weekly_sales']
model=lgb.LGBMRegressor(**params)
model.fit(X_train,y_train,eval_set=[(X_train,y_train),(X_val,y_val)],eval_metric=['mse'],verbose=False,categorical_feature=['shop_id','item_id','item_category_id'],early_stopping_rounds=100)
val_pred=model.predict(X_val)*0.995
mse=mean_squared_error(y_val,val_pred)
print(f'MSE: {mse}')
scores.append(mse)
y_pred=model.predict(X_test)
y_preds.append(y_pred)
print(f'三折交叉的score{scores}')
print(f'三折交叉平均score{np.mean(scores)}')
y_pred=np.zeros_like(y_pred)
for t in y_preds:
y_pred+=t*1/3
sample_submit = pd.read_csv('./线下商店销量预测_数据集/sample_submit.csv')
sample_submit['weekly_sales'] = y_pred
sample_submit['weekly_sales'] = sample_submit['weekly_sales'].apply(lambda x:x if x>0 else 0).values
sample_submit.to_csv('submit.csv', index=False)

欢迎关注我的其它发布渠道